CS798 Project:
Simulating Decorative Mosaics
Jie Xu
CGL, University of
Waterloo
Decorative mosaic is an interesting
art. It is also a research topic in NPR. Unlike stroke based rendering
methods, mosaic uses tiny tiles as "stroke". It gives us a different
feeling. Because we have done something about stroke, silhouette in
assignments, I want to simulate the basic features of mosaic as a new
work. Hausner's paper is a good start.
Algorithm:
The basic algorithm includes such steps:
- Generate a set of points randomly.
For each point, place a square pyramid and align it with direction
field. To identify the pyramid, I use a method that is similar with the
ID image used in assignment2. Each seed point has a ID number. Then the
pyramid color is Colour((ID>>16)&0xff,
(ID>>8)&0xff, (ID)&0xff). So by reading the color, we can
infer which pyramid it belongs to and get other information.
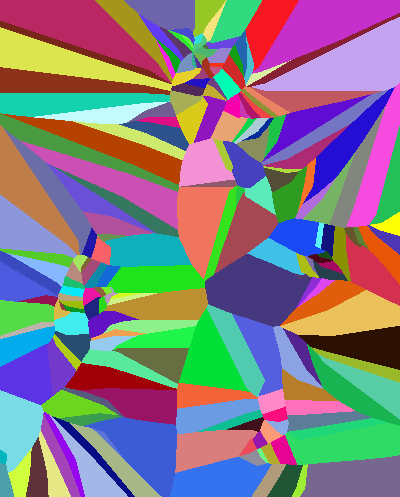
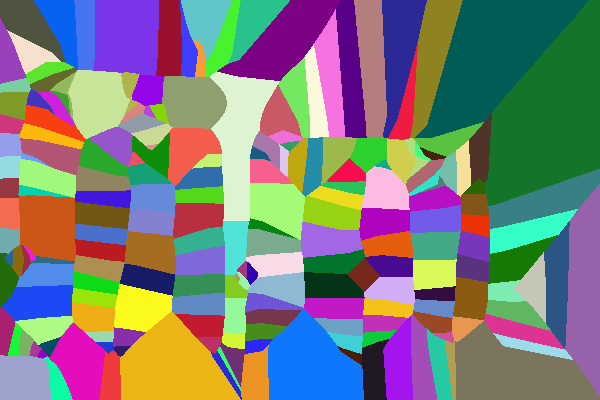
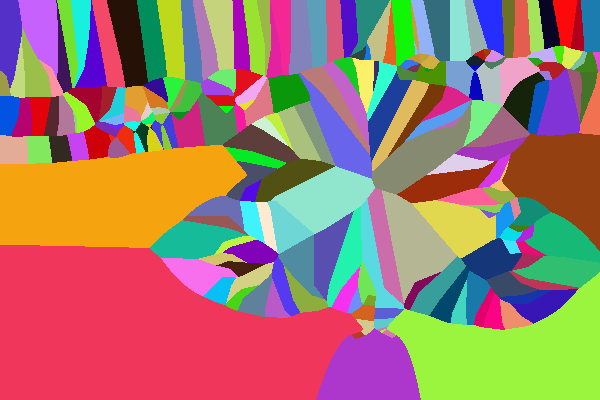
- Render the pyramids with an orthogonal projection to produce a
Voronoi diagram.
- Use Lloyd's algorithm to compute the centroid of each Voronoi
region and update the diagram.
- Render the tiles based on the computed information.
Approach:
To decide the orientation of tiles, a direction field is used.
The direction field is also computed from Voronoi diagram. I
implemented it in three steps:
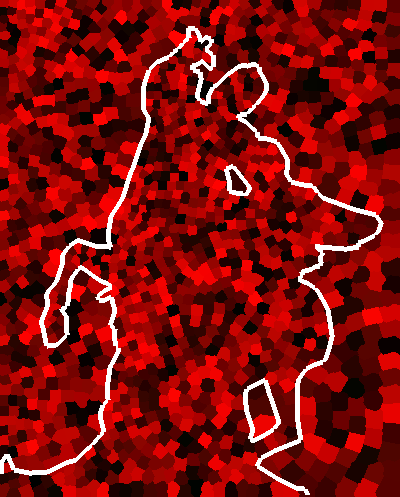
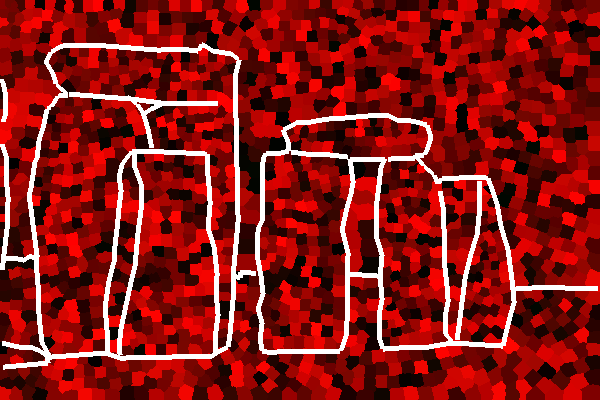
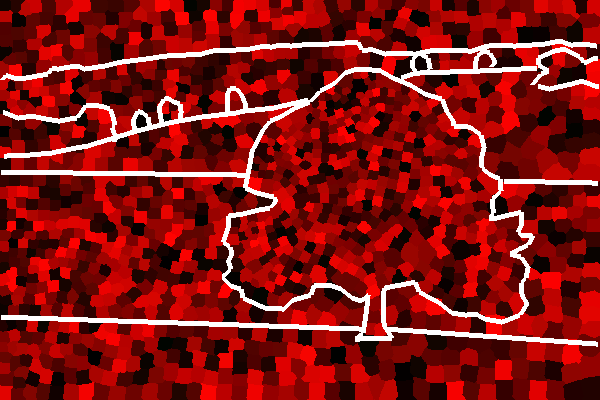
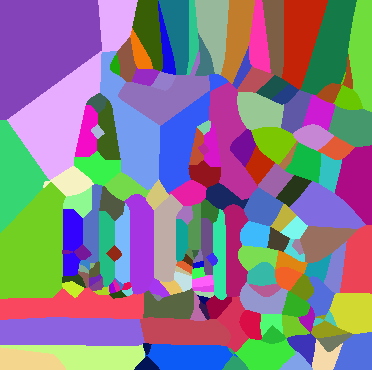
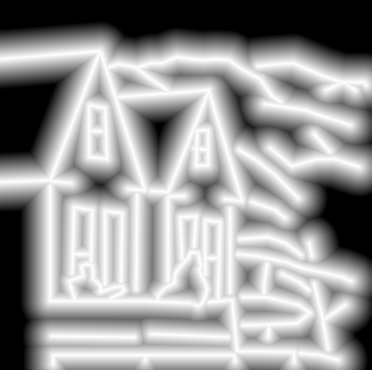
1. Compute generalized Voronoi diagrams along edges using forward
discussed method. The edges are defined by the user.
2. Get depth data from z-buffer, and take z-buffer data as source
image. Using central differencing to compute the gradient in this image.
3. Rotate the rendering units(pyramids) along the gradient direction.
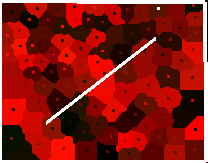
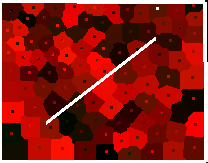
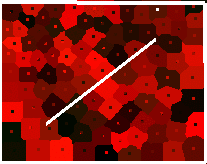
Figure2: Edge avoidance. From left to right: initial stage, user
defined edge, result after 5 iterations, after 10 iterations, final
result after 20 iterations, final tiling.
Using the algorithm, we can get the basic information such as
position, orientation for each tile. We also can setother attributes.
For example, we can get the color of tile by sampling at a point or
compute the average region color in this tile. In my program, I use
average color. The tile size also can be changed. The normal size is
defined by this formula
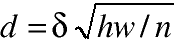
. I set the
constant delta to 0.8. The h and w are the size of source image and n
is the number of seed points. We modify the equation of Manhattan
distance so that the tile size will be changed.
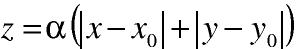
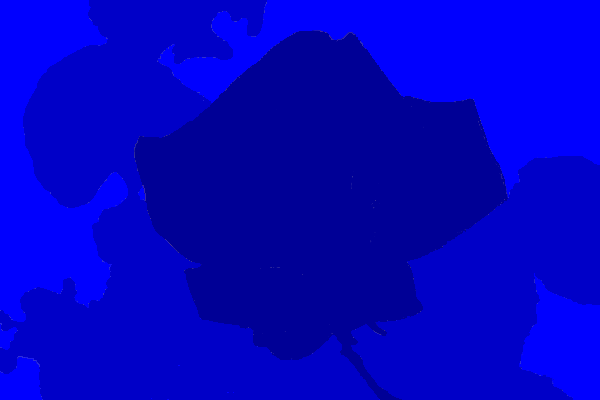
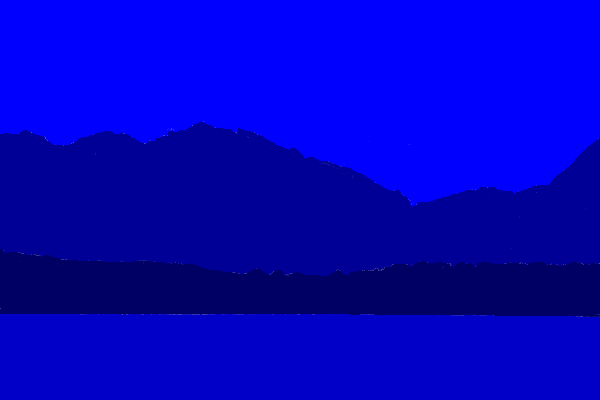
. Alpha is a parameter to control
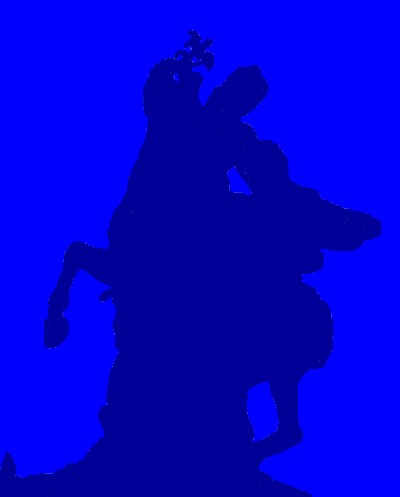
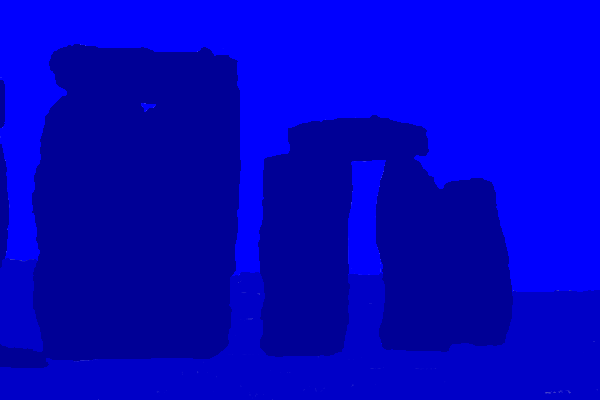
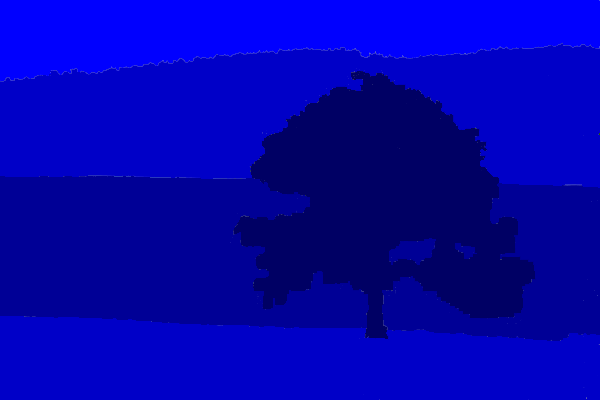
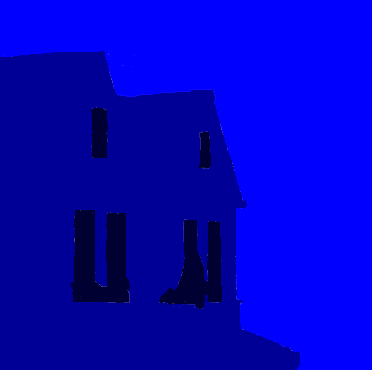
the tile size. In my implementation, the user provide a mask image. It
defines the alpha value for each pixel. By sampling the mask image, we
can create different tiles. The mask image is set with different
colors, and each color mapping to a alpha value. In order to avoid
conflicting with the color of Voronoi diagram, I set the color of mask
image such that they only have blue component. And I defined such
mapping:
blue color component: 0xff -- alpha: 1.0
blue color component: 0xc8 -- alpha: 0.8
blue color component: 0x96 -- alpha: 0.6
blue
color component: 0x64 -- alpha: 0.4
blue color component: 0x32 -- alpha: 0.2
Example:
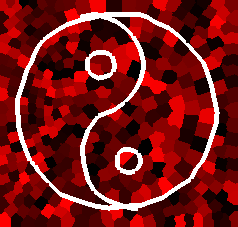
The following example shows the full
procedure. The input image is a pattern of Yinyang. There are 300 seed
points.
Then the user defines the edges and computes according Voronoi diagram.
Computing the centroid using Lloyd's method. The final tiling is the
result after 20 iterations.
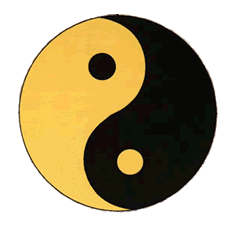
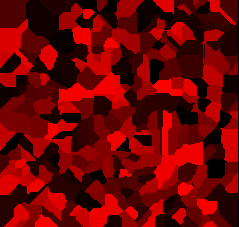
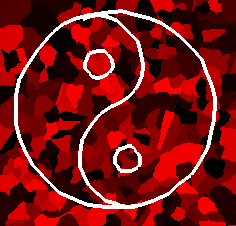
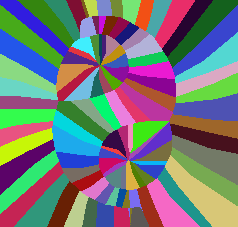
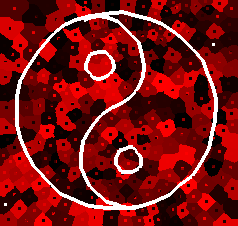
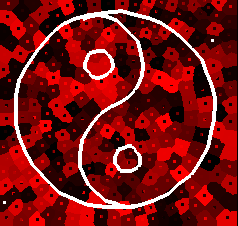

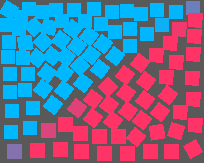
Figure3: Procedure of generating a mosaic. From left to right: source
image, initial stage, user defined edge, edge's Voronoi diagram, result
after 5 iterations, after 20 iterations and final tiling.
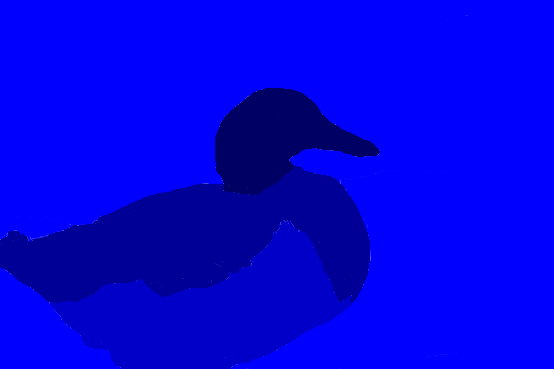
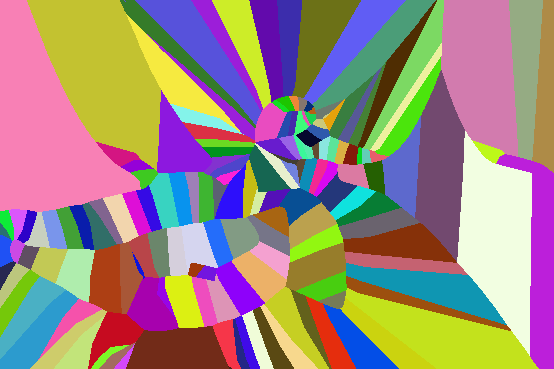
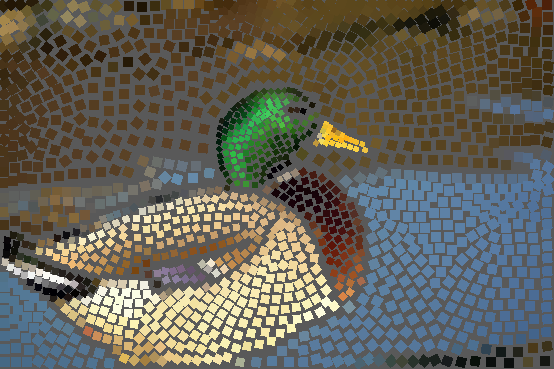
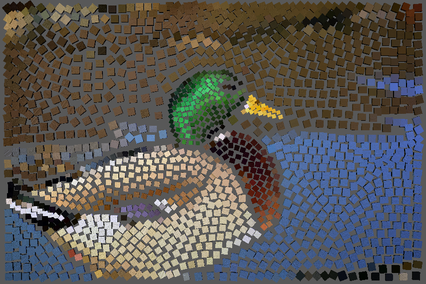
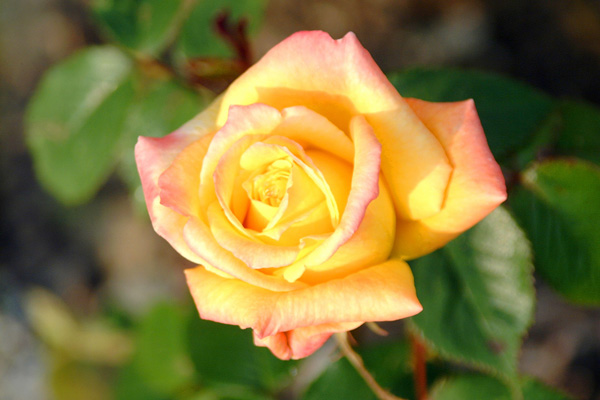
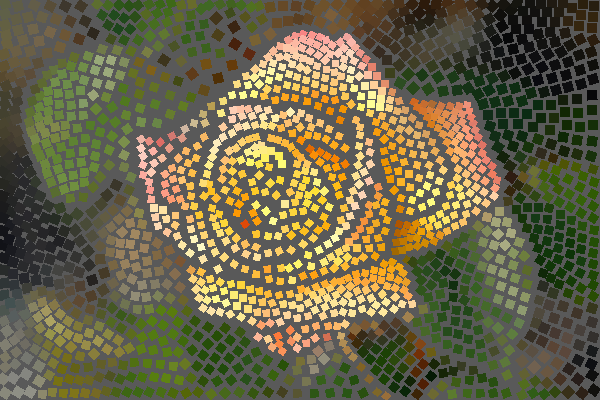
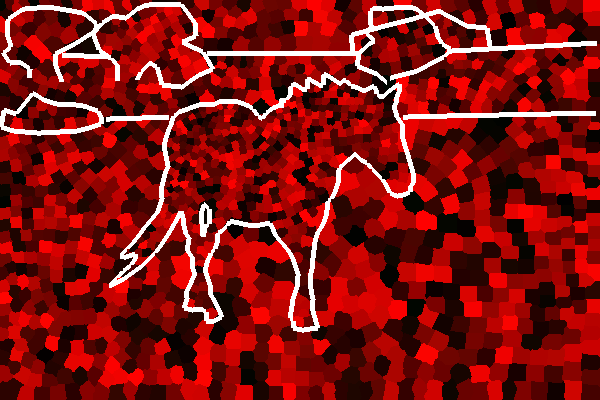
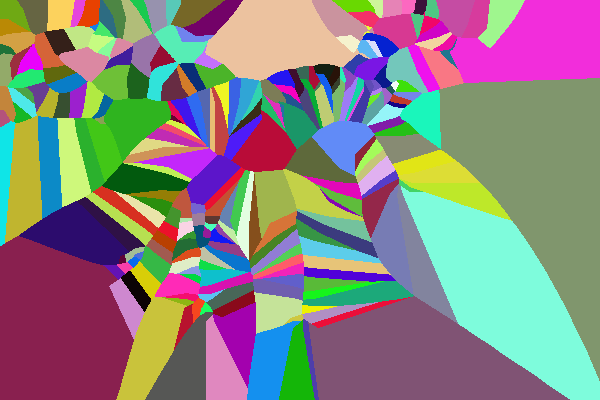
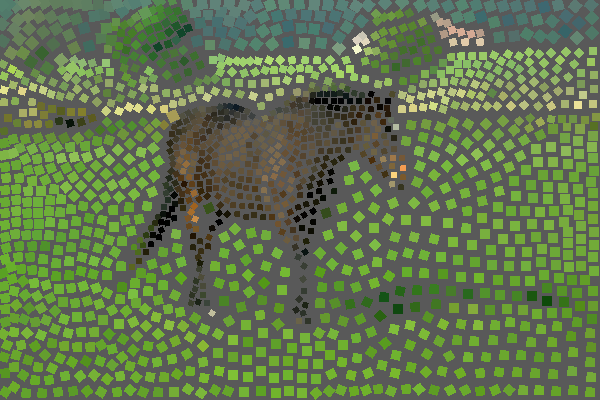
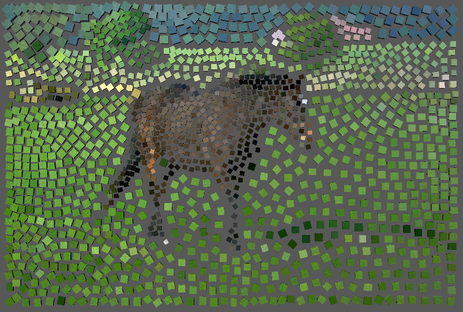
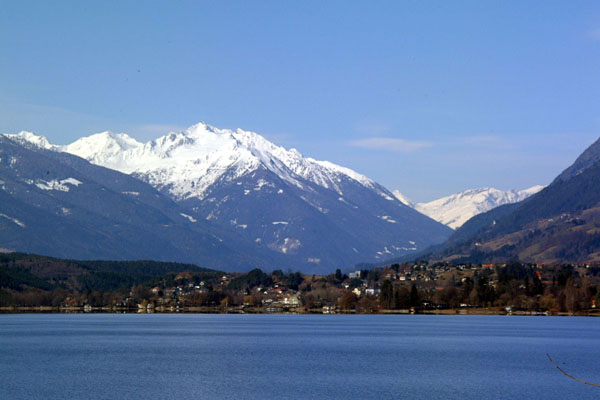
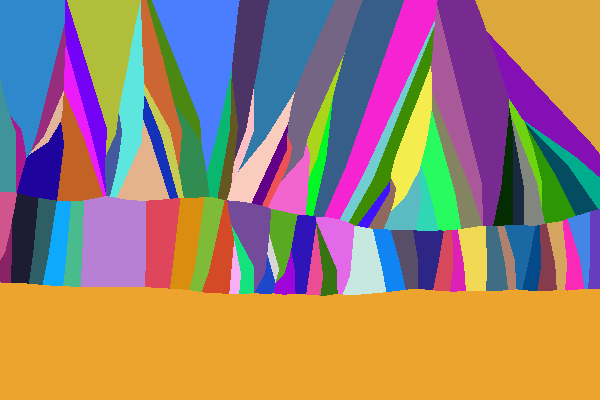
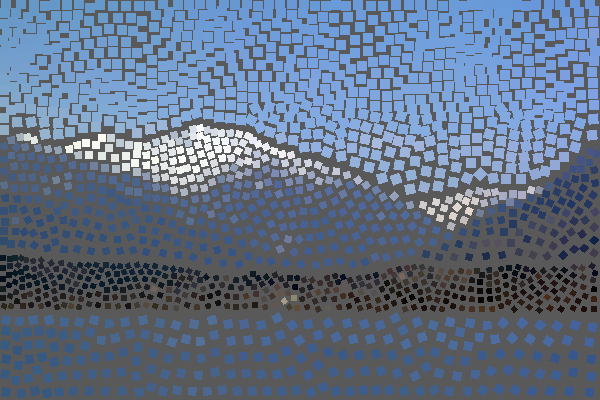
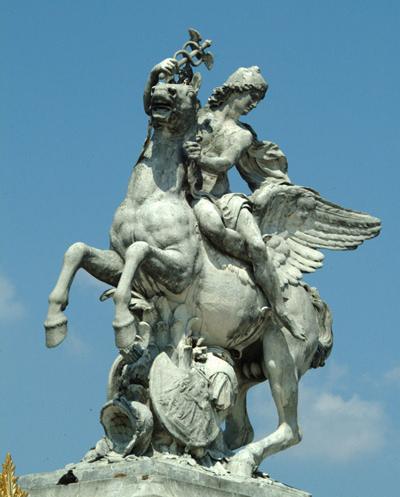
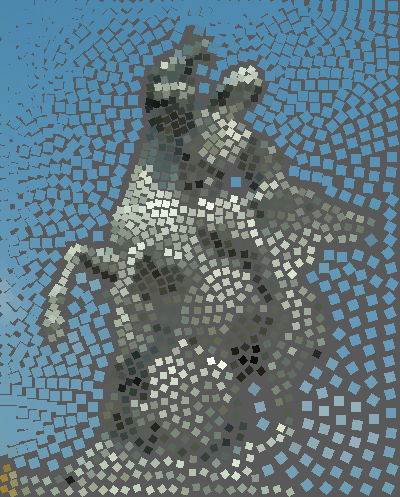
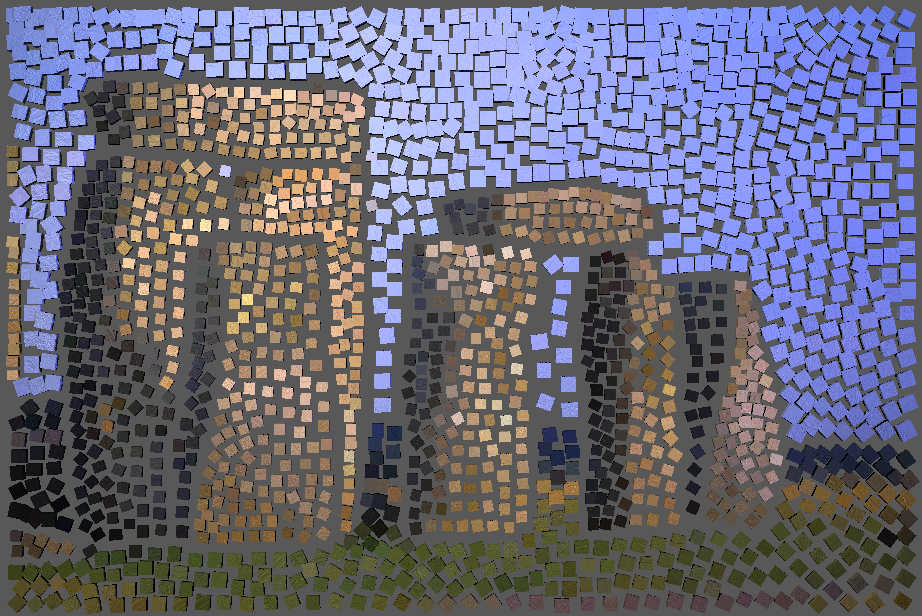
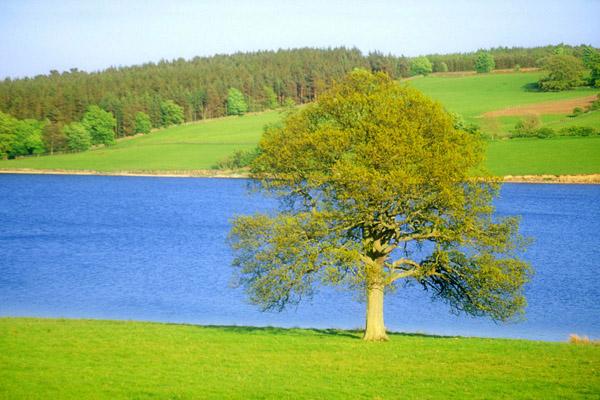
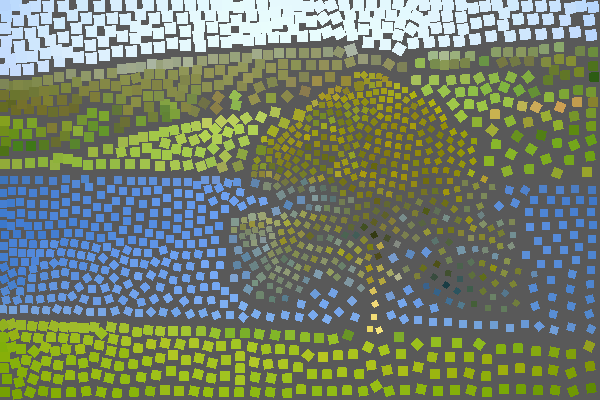
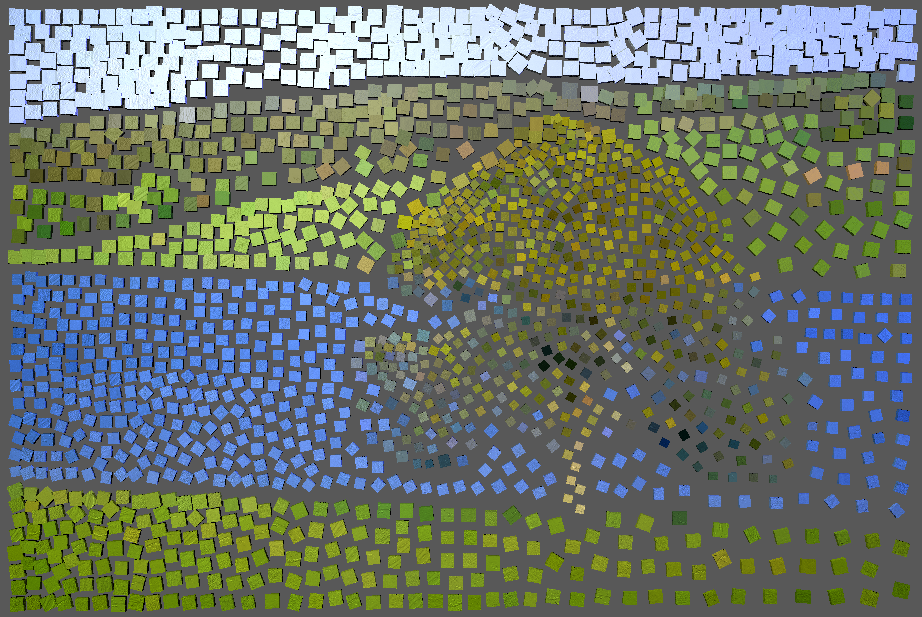
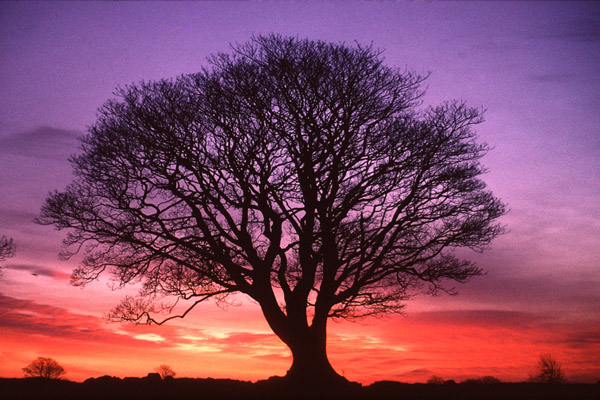
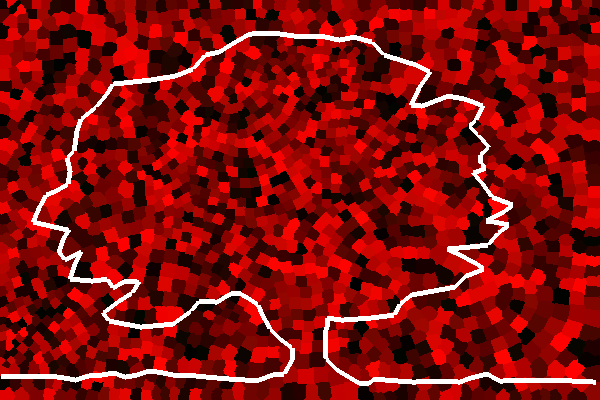
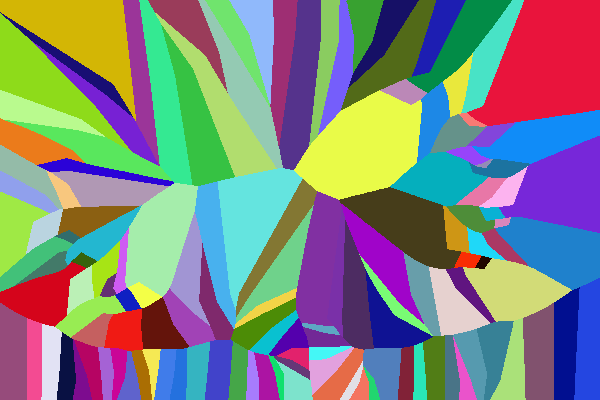
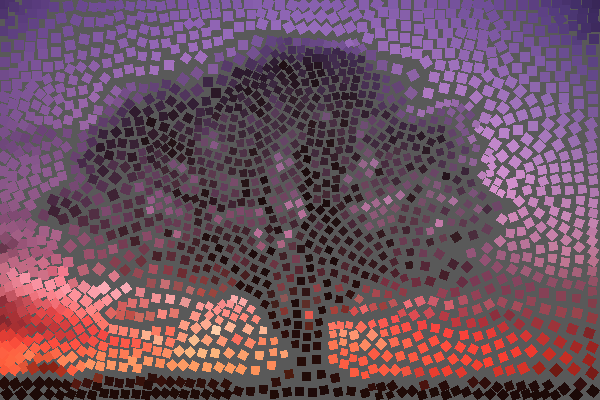
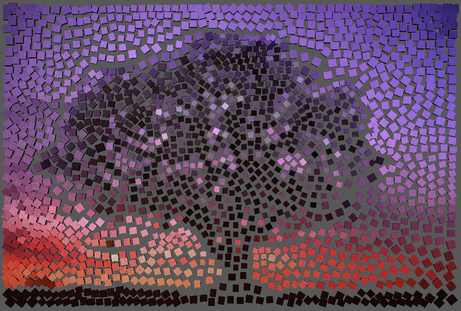
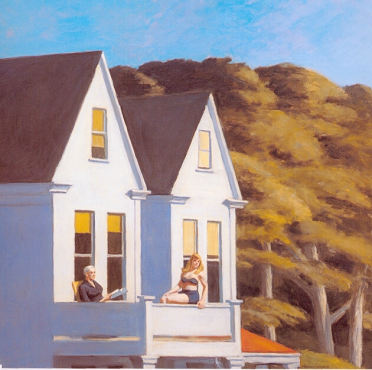
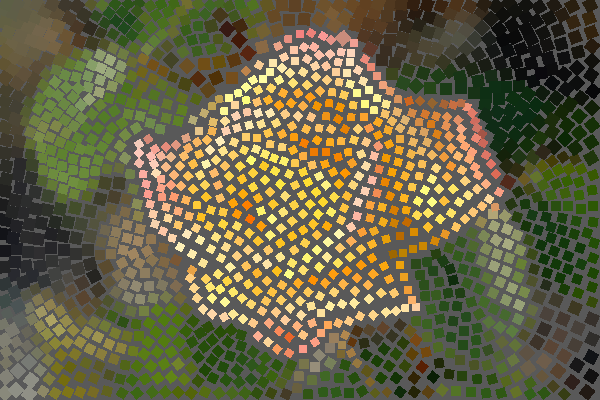
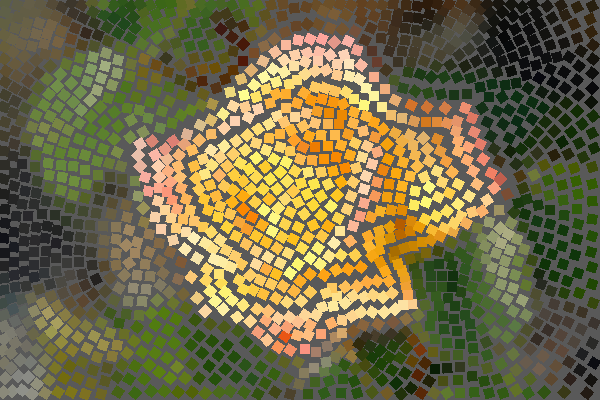
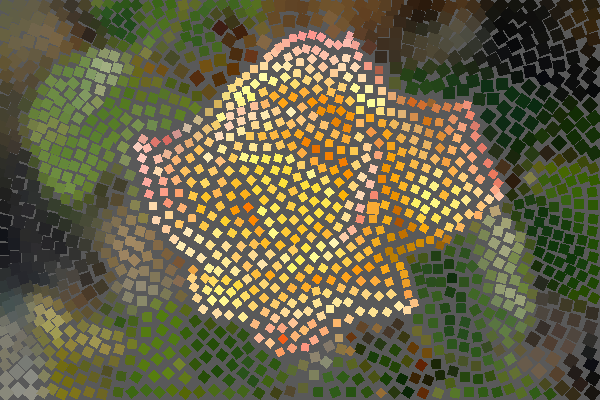
Another more complex example is from
Hausner's paper. I set 2000 seed points. Then input the edges and mask
image. Compute the direction field. Finally generate the tiling after
iterating 20 times. Figure4 displays this example.
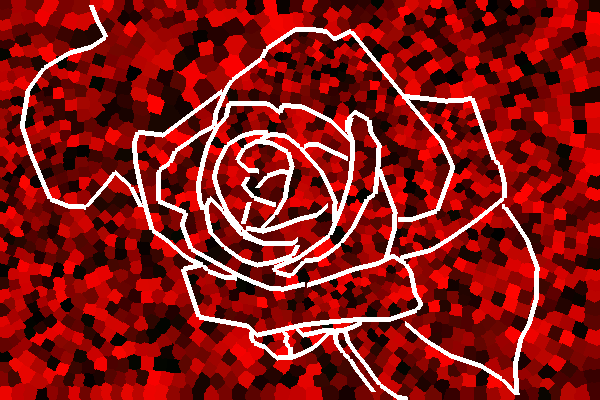
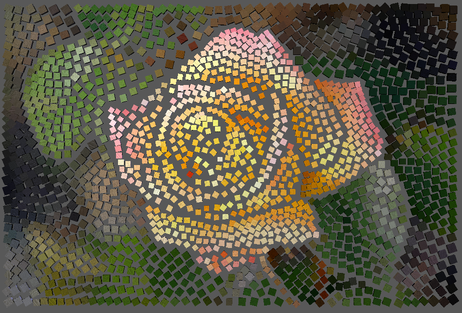
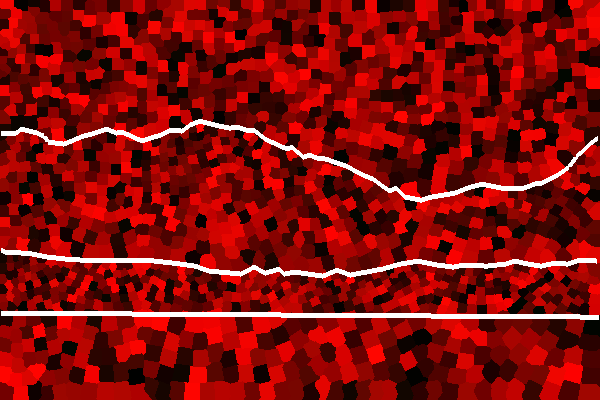
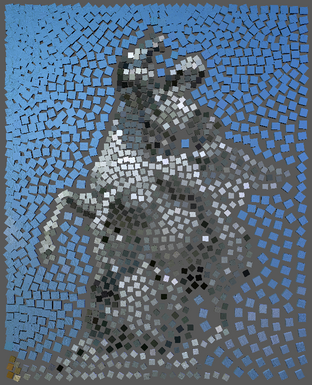
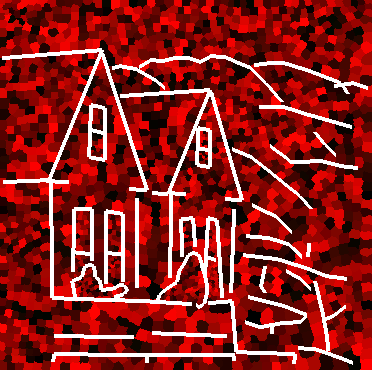
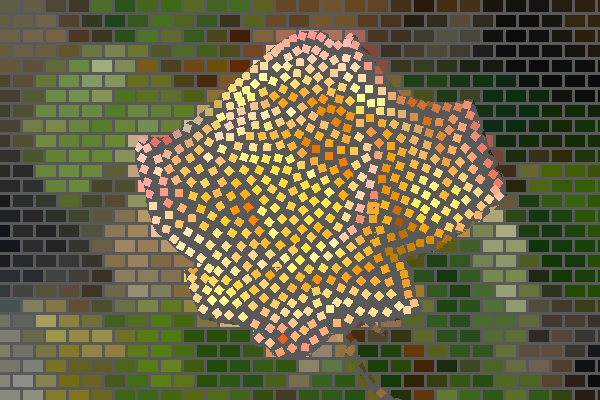
- I also did some simple extensions. People usually use dark color
tile to enforce the edge of shape in moscaics. I simulate it by
displaying the edge lines. I also test the result render litter tiles
instead of lines. Figure5 shows my
result.
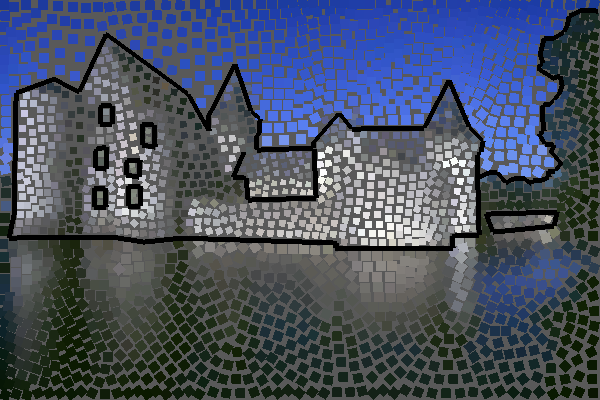

Figure5: Display edge lines.
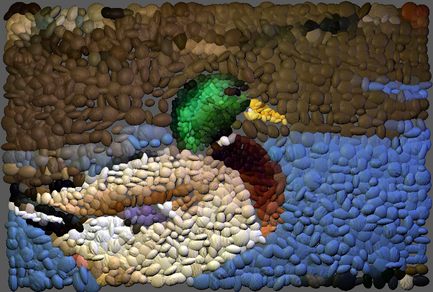
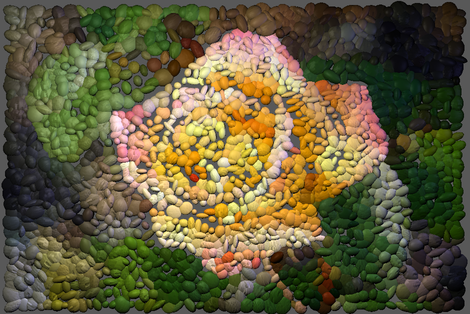
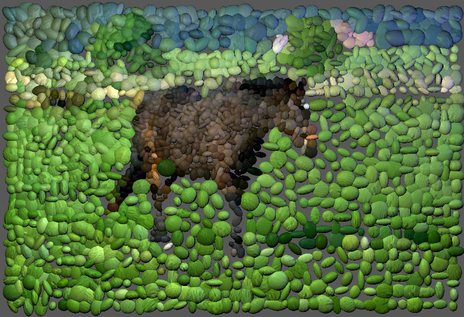
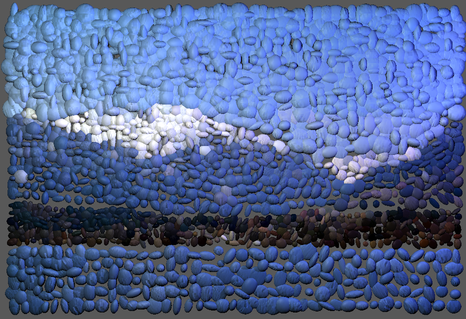
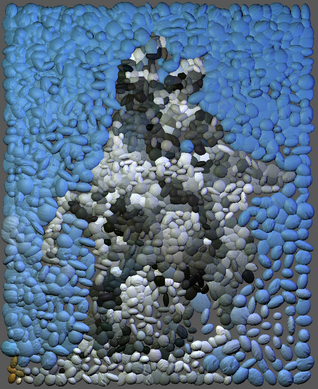
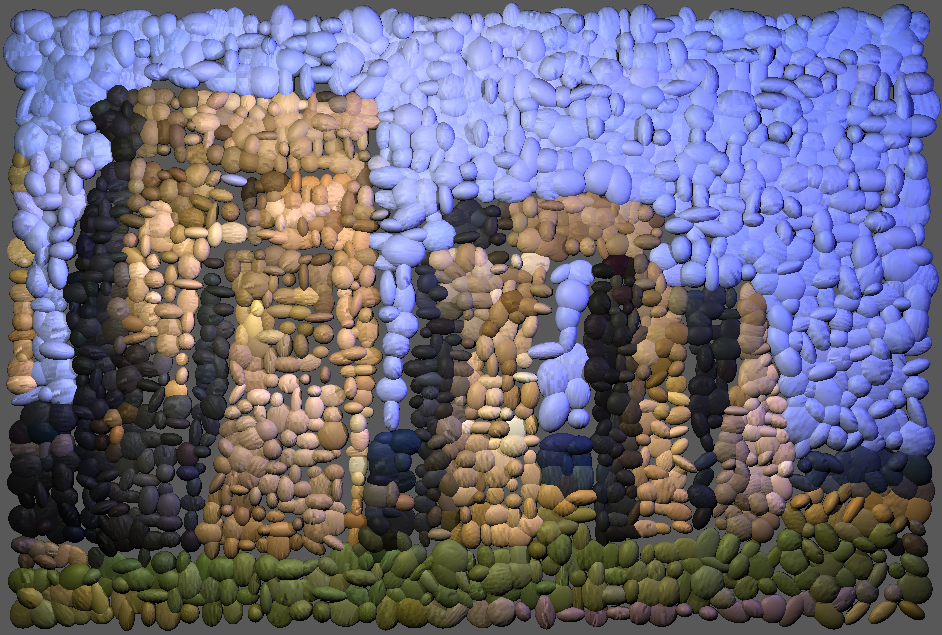
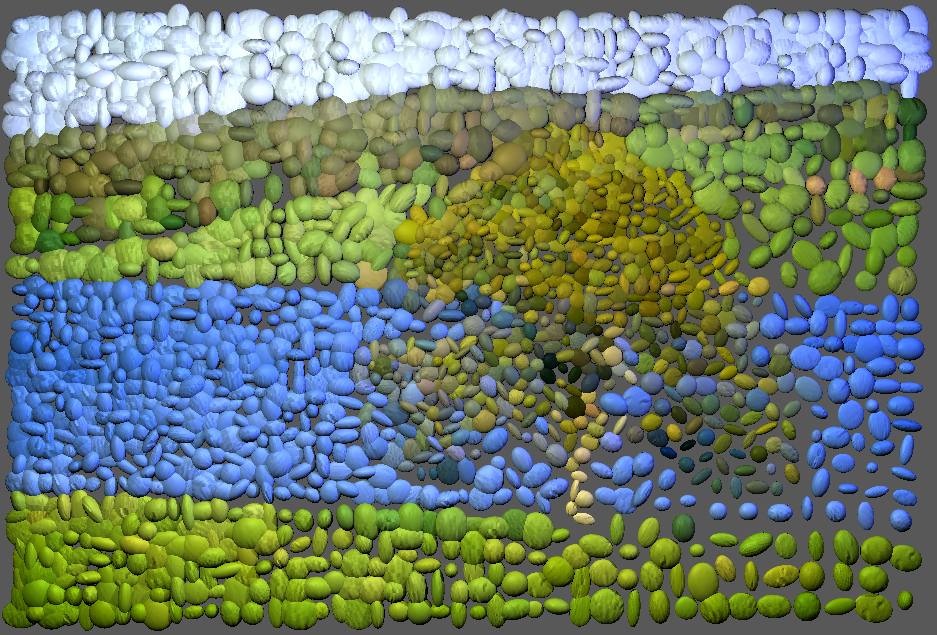
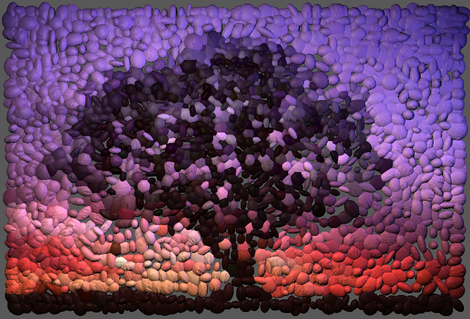
- I find that there are some similar arts, for example, pebble
mosaic. Pebble mosaic is using small pebbles to tile patterns on the
road or wall. Pebble mosaic is an interesting artistic style. In order
to simulate this style, I first generate the normal tiling with the
basic algorithm, then tranform the tile from flat square to ellipsoid
and using tiny random number to perturb the size. I output the result
into python script file and render it using my ray tracer which is
created in CS688. To enhance the result, I also use bump mapping in
rendering. The bump textures are distilled from real pebble pictures
and attribute to pebble tile randomly. I also render the mosaic using
cube tile. Figure6 shows my result.
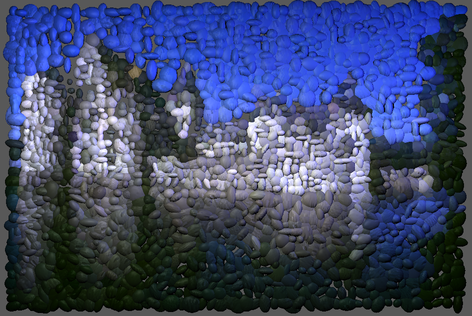
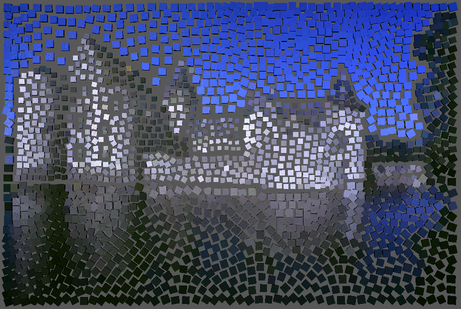
Figure6: Simulated pebble mosaic and cube tile mosaic.
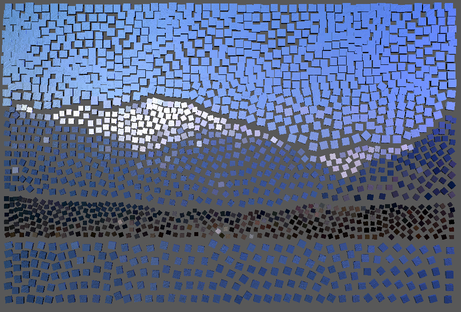
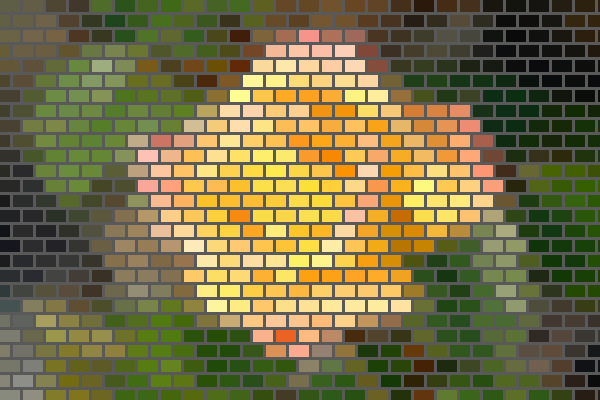
- Another extension is to simulate different mosaic styles. For
example, the opus
classicum and opus vermiculatum styles. To simulate the opus
vermiculatum style, I just draw some parallel edges. Figure7 shows this
example.
Figure7: Simulated opus vermiculatum
style
To simulate the opus classicum style,
I constructed it with two layers. In the first layer, I used regular
pattern to tile the background. In the second layer, I created the
mosaic. Finally, I combined the two layers to get the desired style.
Figure8 shows this style.
Bibliography:
Hoff, K., Keyser, J., Lin, M.,
Manocha, D. and Culver, T. Fast Computation of Generalized Voronoi
Diagrams
Using Graphics Hardware. SIGGRAPH 99: 277-286.
Hausner, A. Simulating Decorative Mosaics. SIGGRAPH 2001: 573-580.
Kim, J. and Pellacini, F. Jigsaw Image Mosaics. SIGGRAPH 2002: 657-664.
More results:


